
By Chuck Sanders, Vice Dean of the Vanderbilt School of Medicine Basic Sciences
Everyone, including me, has strong opinions about the most prestigious scientific journals such as Cell, Science, and Nature, but we all agree we’d like our papers to be published in these “pinnacle” venues! At least in an ideal world, these journals define the norme-de-jour for what scientific publications of the highest-quality and impact look like. No doubt, in the real world many examples can be cited where reality fails to live up to the ideal. Moreover, just because a paper doesn’t make it into one of these top journals doesn’t mean the work is not of the highest quality and impact. Nevertheless, at their best these journals set the bar for scientific excellence.
I am not writing to comment on the merits of the pinnacle journals. Instead, I’d just like to make some quantitative observations about the papers published in them. This is based on my wish to test the hypothesis that the bar to getting a paper into one of these journals is rising with time, particularly in terms of how much data are packed into each paper. The journal I selected for analysis is AAAS’s Science, chosen both because I subscribe to it and because its Reports paper format was essentially unchanged from at least 1994 to 2022, facilitating analysis of temporal trends.
Here’s what I did. First, I selected 1994, 2004, 2014, 2022, and 2024 (note that, by 2024, the Reports format had been eliminated from the journal in favor of the slightly longer Articles format, so the 2024 data are for Articles). I browsed the Science table of contents in each selected year for early-in-the-year issues, selecting 10 Report papers in each year for which the titles indicate that they fall into the broad genre of “molecular biosciences.” Only the titles were considered in choosing which Reports to analyze. I then collected some simple metrics on each paper, which are tabulated in a linked Microsoft Excel file. From the data in this table, it is possible to make some observations about how the bar for publishing research in Science has changed over the past 30 years.
Here’s what I found.
Density of Data in Each Paper
The figure below illustrates the average number of figure panels (primary + supplementary) published in Science papers from 1994 to 2024.
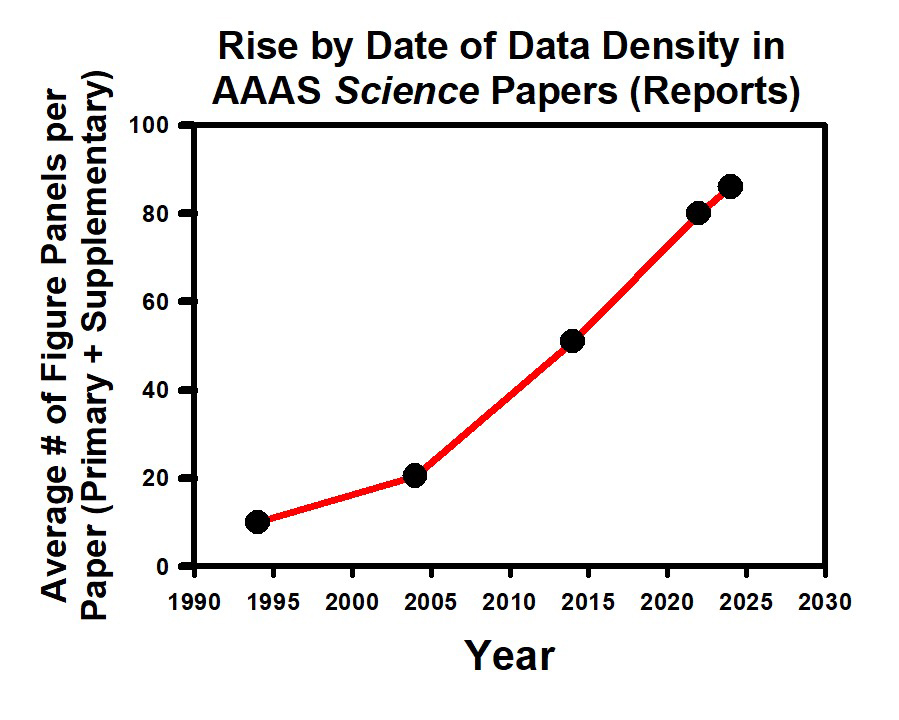
1994 was near the end of the pre-Internet age, meaning that the average of 10 total figure panels for papers published that year reflect only the 3 or 4 primary figures per paper published in the actual, physical journal. By 2004, the journal had gone online and the number of figure panels jumped thanks in part to the introduction of online-only Supplementary figures. However, the trend towards higher numbers of figure panels for each paper continued to increase steeply from 2004 through the present. (I note that the medians for each analyzed year are very similar to the mean values shown in the figure—see the data file.) In 2022 there were an average of 80 (SD=38) panels published in each Science paper!
Number of Authors
The average number of authors per paper also increased from 1994 to 2024. Because there are outlier papers that have many dozens of authors, the median values are more revealing than the mean. The median number of authors was fairly even from 1994 through 2014: in the 5-to-7 range. However, this jumped to 13 in 2022 and 16 in 2024.
Time from Submission to Acceptance
The average time between submission and acceptance was fairly flat—in the 2–3.5-months range from 1994 through 2014—but it then more than doubled to 7.6 months in 2022 and 2024. There were a few recent papers with unusually short times to acceptance that possibly represented editorial urgency (in 2022 a couple of COVID-19 papers were accepted two months after submission and in 2014 two of the original TRP channel structure papers were accepted only a month after submission).
A Qualitative Observation About Types of Papers Published
For 1994 and 2004 it was easy to find 10 papers that clearly fell in the realm of “molecular biosciences” in just a couple of issues of Science. However, by 2022 I found it much harder and had to go through many issues just to be able to complete a list of 10.
Whether the observations summarized above for Reports papers in Science apply to comparable types of papers published in Cell and Nature is not established by these data. I would guess so, but I do not know. In any case, at least for Science, there clearly has been a general trend to publish work that is backed by increasingly abundant data. It is no longer unusual for a paper to have over 100 individual data panels. Not surprisingly, the size of the research team required to generate such enormous amounts of data is also trending upward—scientific projects that are now recognized as being of the very highest significance increasingly require a team science approach. The fact that there seem now to be fewer pinnacle papers being published that, from their titles, clearly fall in the realm of “molecular biosciences” seems to reflect NOT an abandonment of this area of science, but rather that molecular work is increasingly integrated into projects with an even broader scope, such as systems biology, physiology, neuroscience, disease mechanisms, and/or other areas of biology or medicine.
To the extent that it is a personal goal to conduct research that will yield publishable units of results competitive for publication in a pinnacle journal (or at least in AAAS’s Science), the observations made in this short exercise may have implications regarding optimal training, project selection, cultivation of collaborative relationships, and funding strategies.