Retinotopic maps in the pulvinar of bush baby
Retinotopic maps in the pulvinar of bush baby (otolemur garnettii)
K. Li1, J. Patel2, G. Purushothaman2, R.T. Marion3 andV.A. Casagrande1,2,3,4,*
Article first published online: 23 AUG 2013 DOI: 10.1002/cne.23358
Abstract
Despite its anatomical prominence, the function of the primate pulvinar is poorly understood. A few electrophysiological studies in simian primates have investigated the functional organization of pulvinar by examining visuotopic maps. Multiple visuotopic maps have been found for all studied simians, with differences in organization reported between New and Old World simians. Given that prosimians are considered closer to the common ancestors of New and Old World primates, we investigated the visuotopic organization of pulvinar in the prosimian bush baby (Otolemur garnettii). Single-electrode extracellular recording was used to find the retinotopic maps in the lateral (PL) and inferior (PI) pulvinar. Based on recordings across cases, a 3D model of the map was constructed. From sections stained for Nissl bodies, myelin, acetylcholinesterase, calbindin, or cytochrome oxidase, we identified three PI chemoarchitectonic subdivisions, lateral central (PIcl), medial central (PIcm), and medial (PIm) inferior pulvinar. Two major retinotopic maps were identified that cover PL and PIcl, the dorsal one in dorsal PL and the ventral one in PIcl and ventral PL. Both maps represent central vision at the posterior end of the border between the maps, the upper visual field in the lateral half and the lower visual field in the medial half. They share many features with the maps reported for the pulvinar of simians, including the location in pulvinar and the representation of the upper–lower and central–peripheral visual field axes. The second-order representation in the lateral map and a laminar organization are likely features specific to Old World simians. J. Comp. Neurol. 521:3432-3450, 2013. © 2013 Wiley Periodicals, Inc.
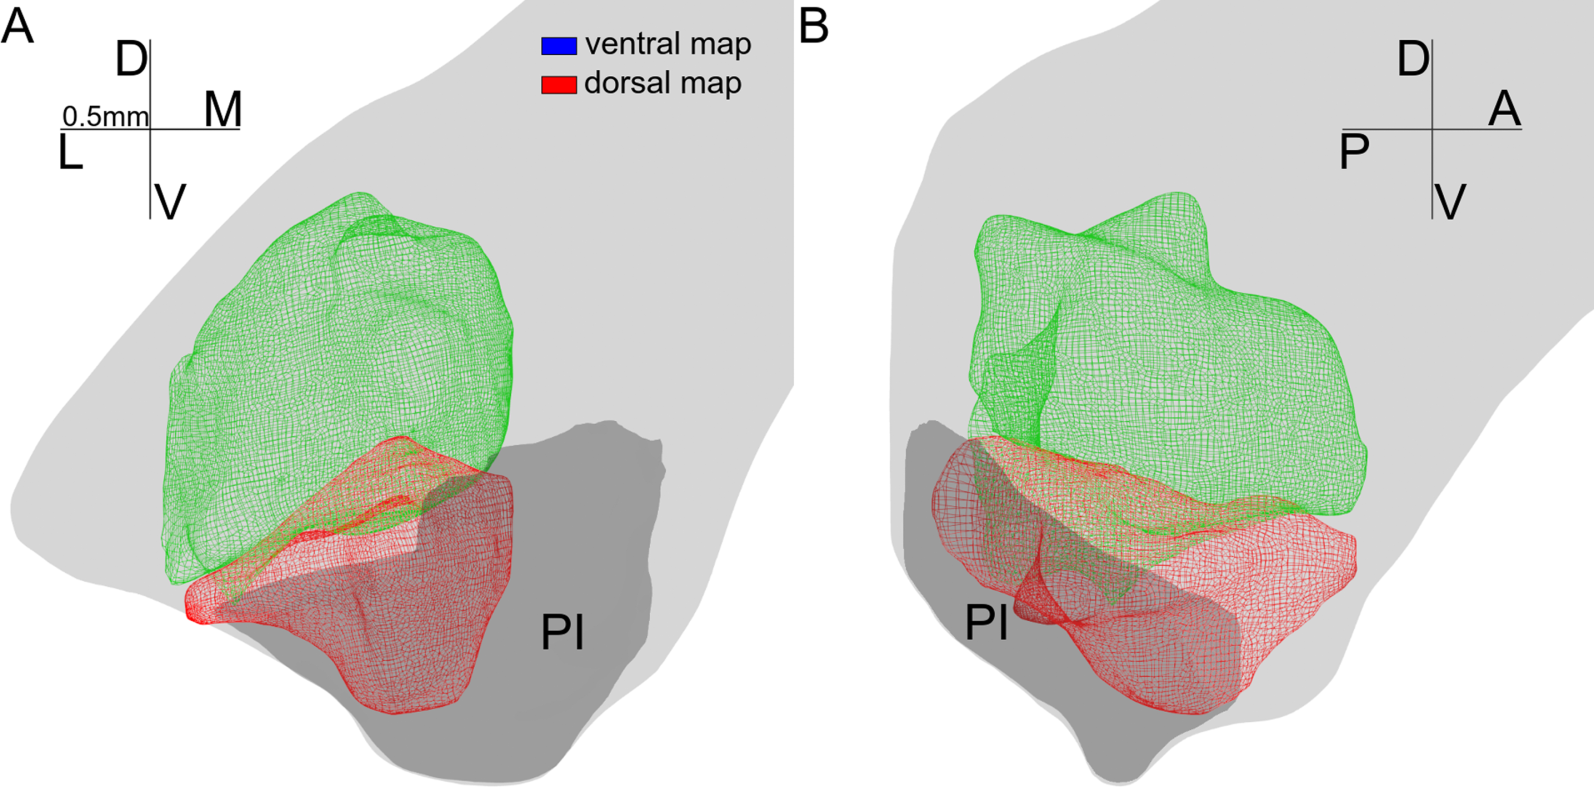
Figure 3.
3-D views of the dorsal (green) and ventral (red) map. The model of the dorsal map contains all recorded units showing receptive fields before the progression reversal. Similarly, the model of the ventral map contains all recorded units after the receptive progression reversal. Both models were smoothed, so a few (fewer than five for each structure) recording sites are left out. A coronal view is shown in A, and a parasagittal view is shown in B. Light gray shows the outline of the pulvinar. Dark gray shows the outline of the inferior pulvinar. D, dorsal; L, lateral; V, ventral; M, medial; A, anterior; P, posterior. Each arm of the compass is 0.5 mm in the model. [Color figure can be viewed in the online issue, which is available at wileyonlinelibrary.com.]